A grown up enthusiastic kid with dreams sky high
Environment: Sql Server 2008 R2 & 2012, ASP.Net, C#, ER Studio, SSIS & SSRS
Domain: Healthcare & Banking
# Involved in Data modelling, ER Modeling and created database structure for an entirely new product. The project required a star - schema databse model since it is an OLTP database that involves daily transactions and the database has to be normalized as much as possible.
# Developed Stored procedures to handle business logics at the backend. Views has been created to mask the stored procedure for security reasons, that calls the stored procedures instead.
# Developed SQL Server database objects – tables, user definedfunctions, views, indexes, stored procedures, cursors and triggers.
# Extracted and transformed data using DTS Import/Export Wizards, Bulk Insert, BCP and SQLServer Integration Services (SSIS) packages and scheduled jobs, alerts, DTS/SSIS Packages in SQL server.
# Extensively used SSIS transformations such as Lookup, Derived column, Data conversion, Conditional split, Script task and Send Mail task
# Visualized data by consolidating data from different data sets; Developed Tableau visualizations and dashboards using Tableau Desktop.
# Created action filters, parameters and calculated sets for preparing dashboards and worksheets in Tableau 10
# Developed Tableau workbooks from multiple data sources using Data Blending. Created story board to paint a broader picture. Created action filters, parameters and calculated sets for preparing dashboards and worksheets in Tableau 10
# Hosted developed dashboards from Tableau Desktop to Tableau Server for the use of other stakeholders within the organization
# Developed reports and dashboards from different CRM data sets like PeopleSoft, Salesforce using Report Builder (SSRS) & Power BI
# Migrated reports from Hyperion to Tableau for better insights and reporting structure within the admission services of the university
# Retrieved data from SQL server databases and reported various metrics and KPI's using SQL Server Reporting Services (SSRS). Developed Linked, Sub-reports, drill down and drill through reports and hosted it in Sharepoint and SSRS server
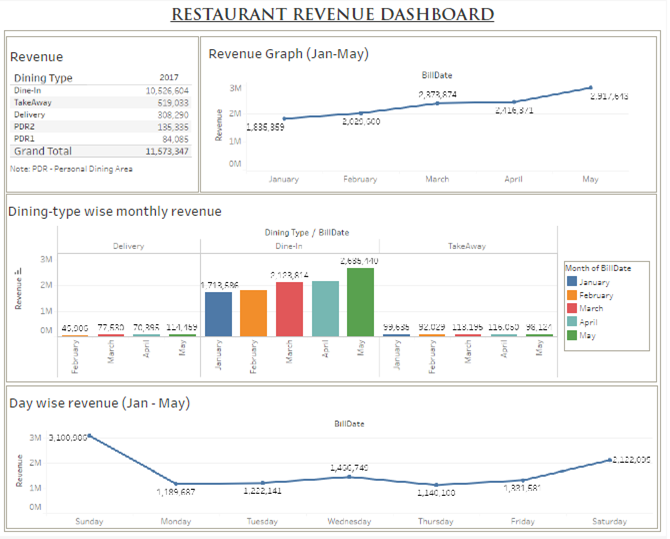
# Gathered expenditure and revenue data from a restaurant business and reported various KPI’s and parameters through reports in Tableau. Designed and developed Tableau workbooks from multiple data sources using data blending.
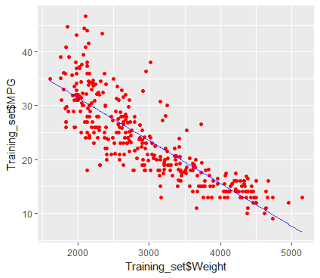
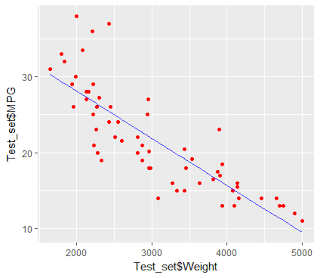
Analyzed various independent variables of cars and predicted the dependent variable Miles per Gallon (MPG) using backward elimination method. Used caTools package for regression and plotted the graph with ggplot2 package in R studio.
Comparing multiple independent variables against the dependent variable using Backward Elimination method
The formula goes as:
y = b0 + b1x1 +b2x2 +b3x3 .... bnxn
y = Dependent Variable
x = Independent Variable
b0 = Constant
b1,b2.. = Co-effecients
Took sample data to analyze and implement the above formula.The sample data can be acquired from various open source sites. For this example I took data from https://archive.ics.uci.edu/ml/datasets/Auto+MPG. This data is all about different models of cars with attributes and we are going to find out how these attributes are used to predict the MilesPerGalon attribute. The following steps have been performed to predict the dependent variable mpg and found out weight of the car plays an important role in predicting the miles per gallon.
Step 1: Install/Call the needed packages
Step 2: Data pre processing - preparing training set and test set
Step 3: Perform the regression analysis on the training data and then perform against the test data
Step 4: Plot the data on the graph
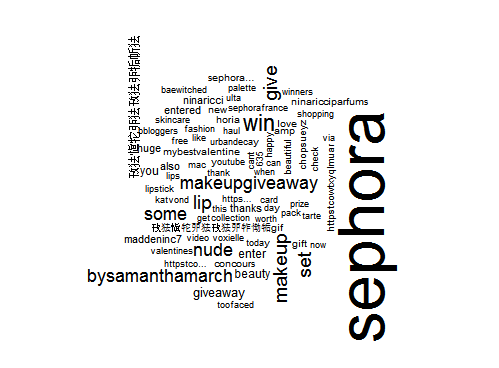
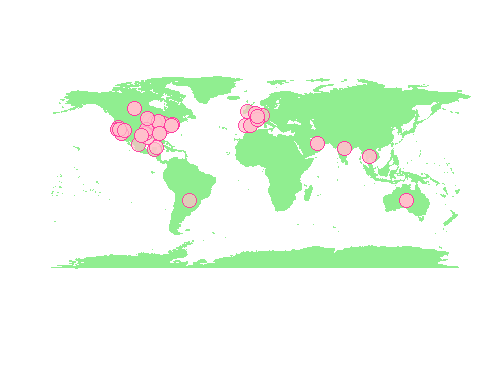
Analyzed twitter feeds for the Sephora product to get the user sentiments and buzz words for the product. Understood text mining techniques and used packages in R to form the word cloud. Also plotted the tweets in a map to understand the demogrpahics of the customers and to target the emerging markets and new trends in any particular country.